
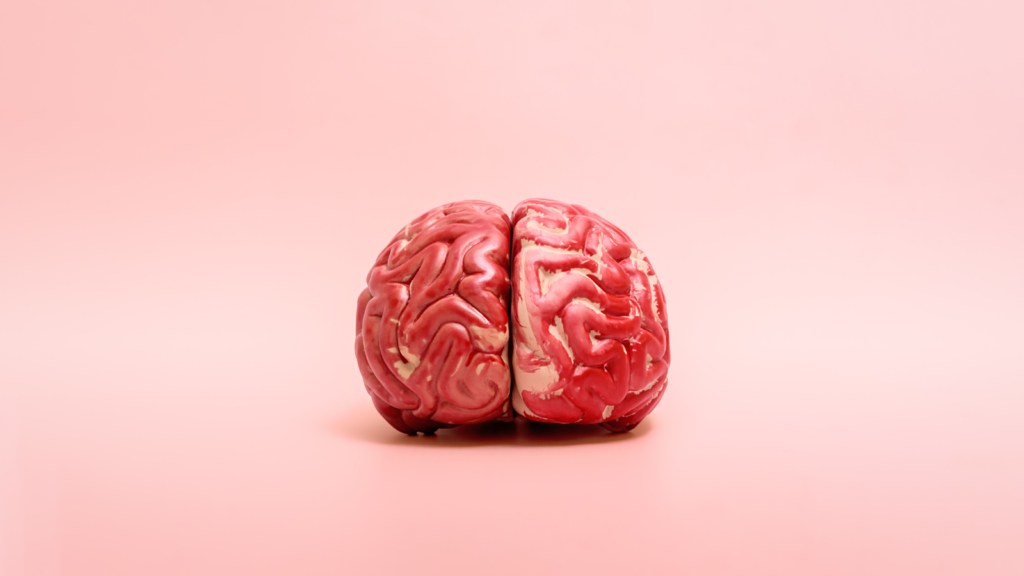
What Does EEG Measure?
Your brain is made up of billions of cells which emit electrical activity, this activity is what EEG measures. As brain cells communicate, they produce waves of electricity. Any synaptic activity creates a small electrical impulse also known as a postsynaptic potential. When thousands of neurons fire at the same time, they generate a strong enough electrical field to measure on the surface of the head.
A good comparison would be an earthquake. Small rumbles, on their own would go unnoticed however, if several occur in sync, in the same place, at the same time. They create a very noticeable event that can be felt for hundreds of miles away.
What is EEG and how does it work?
Electrodes placed on the skull detect neural waves, and differences in the signals detected between provide insight into what’s happening in response to certain stimuli. For faster application, the electrodes are mounted in elastic caps, ensuring that the data can be collected from identical scalp positions across all respondents.
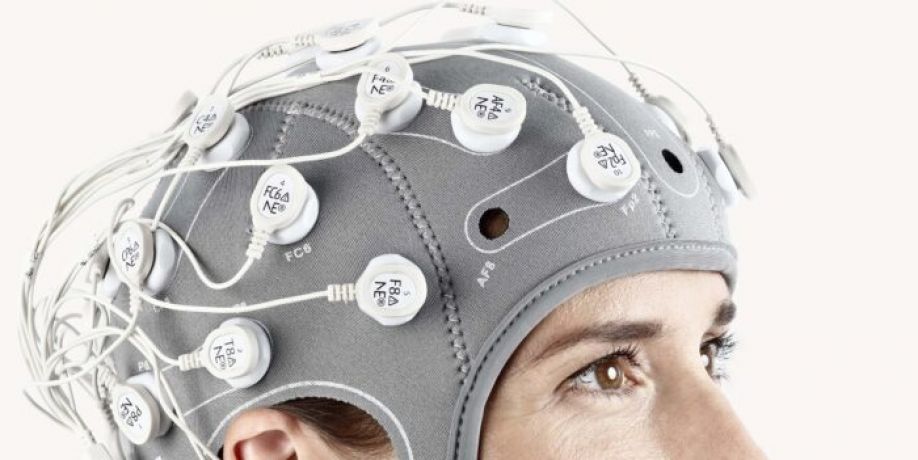
The recorded data is sent to an amplifier, the data is then shown as a sequence of voltage values.
What Does The EEG Data mean?
As EEG monitors the time sequence of electrical activity generated by the brain, you can interpret which areas of the cortex are responsible for processing information at a given time.
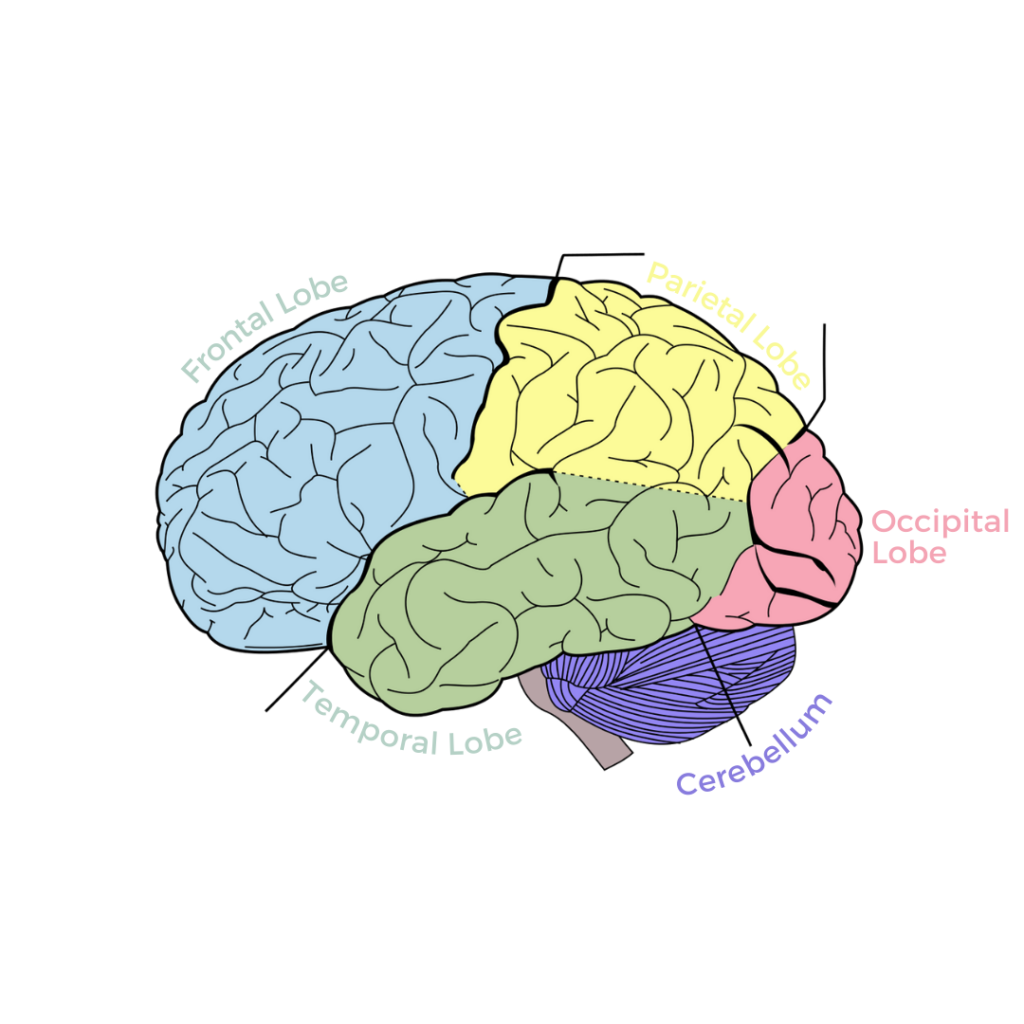
Areas of the brain and what they do
1. Occipital cortex
The occipital cortex is the visual processing centre of our brain, located in the rearmost portion of the skull. All the things that we see are processed here (although some processing does also occur before and after the signal arrives). EEG experiments with visual stimuli (videos, images) often focusing on effects in occipital regions.
2. Parietal cortex
The parietal cortex is all about integrating information from outside sources with internal sensory feedback from our body. The parietal cortex is responsible for merging all these information sources into a coherent representation of how our body relates to the environment, and how all things (objects, people) in the environment relate to us. Tasks requiring eye or hand movements as well as eye-hand coordination would be impossible without parietal cortex, which also processes, stores, and retrieves the shape, size, and orientation of objects to be grasped.
3. Temporal cortex
The temporal cortex is associated with processing sensory input to derived, or higher, meanings using visual memories, language, and emotional associations. The left temporal cortex is involved in the comprehension of written and spoken language.
4. Frontal cortex
The frontal part of the human brain is enlarged compared to most other mammals. Basically, the frontal cortex is all about executive function: it helps us maintain control, plan, and monitor our behaviour. Apart from the regional characteristics of where certain electrical activity originates, you can also analyse which frequencies primarily drive the ongoing activity.
The signal generated from the neural flutters are made up of many underlying base frequencies, which are meant to reflect certain cognitive, affective, or attentional states. When your brain reacts and changes its current state, the patterns will shift, providing insight into cognitive processes.
EEG Frequency Ranges/Frequency Bands
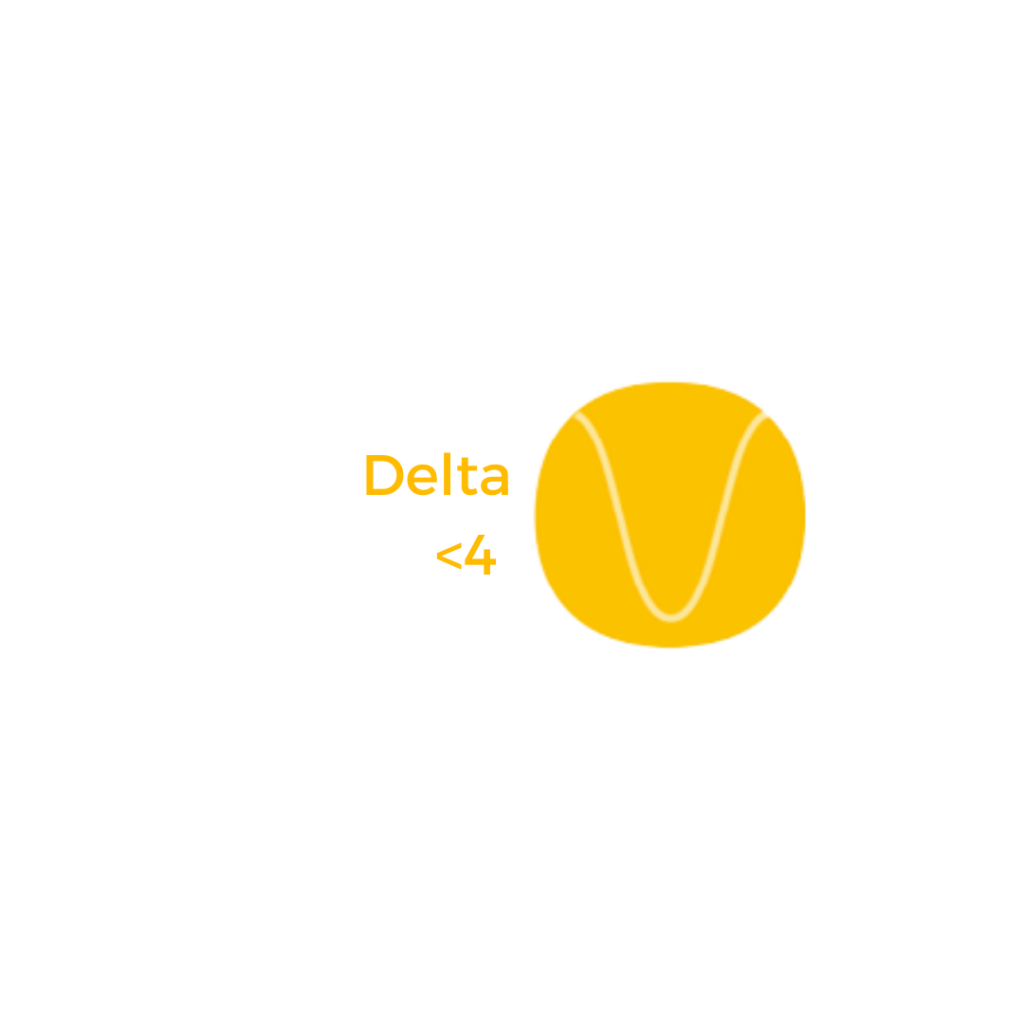
Delta (1 – 4 Hz)
Delta in sleep labs, delta waves are examined to assess the depth of sleep. The stronger the delta rhythm, the deeper the sleep. Increased delta power (an increased quantity of delta wave recordings) has also been found to be associated with increased concentration on internal working memory tasks.
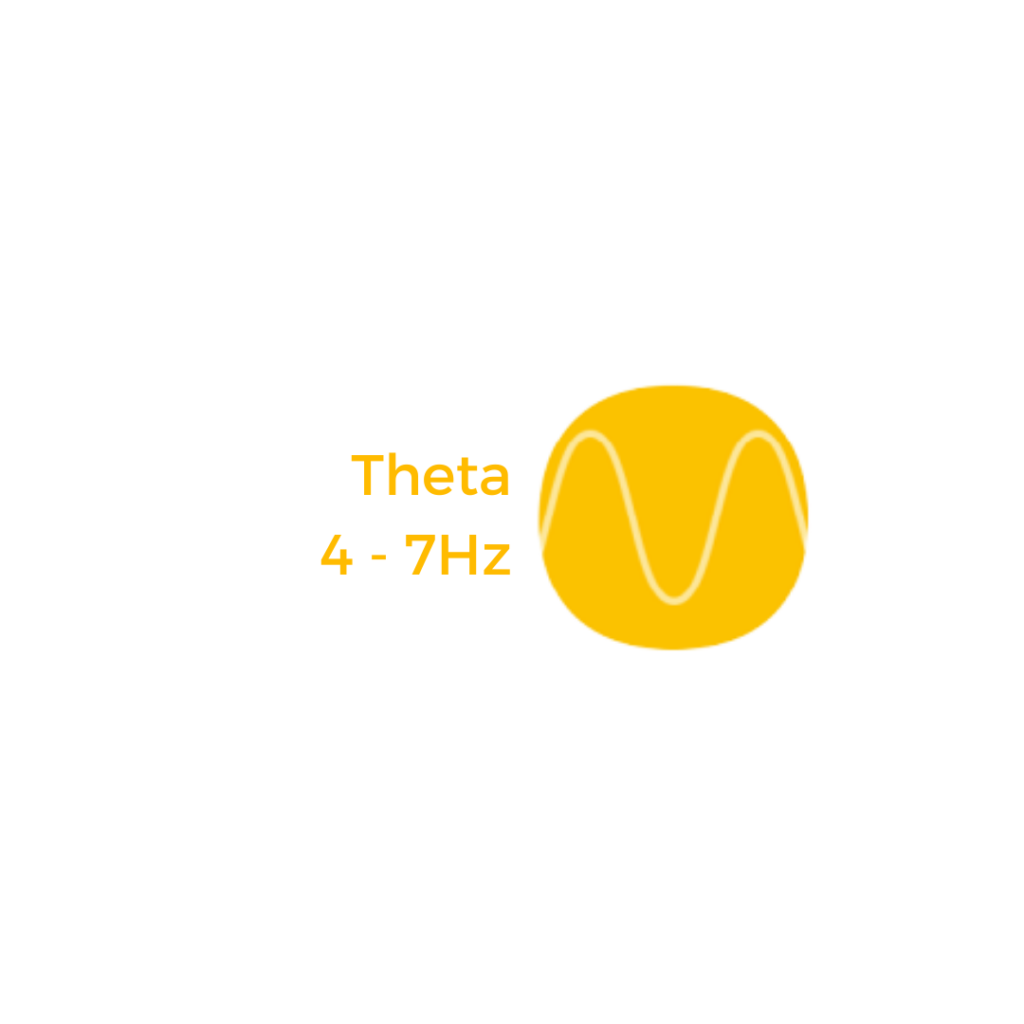
Theta (4 – 7 Hz)
Theta is associated with a wide range of cognitive processing such as memory encoding and retrieval as well as cognitive workload. Whenever we’re confronted with difficult tasks (counting backwards from 100 in steps of 7, or when recalling the way home from work, for example), theta waves become more prominent. Theta is also associated with increased fatigue levels.
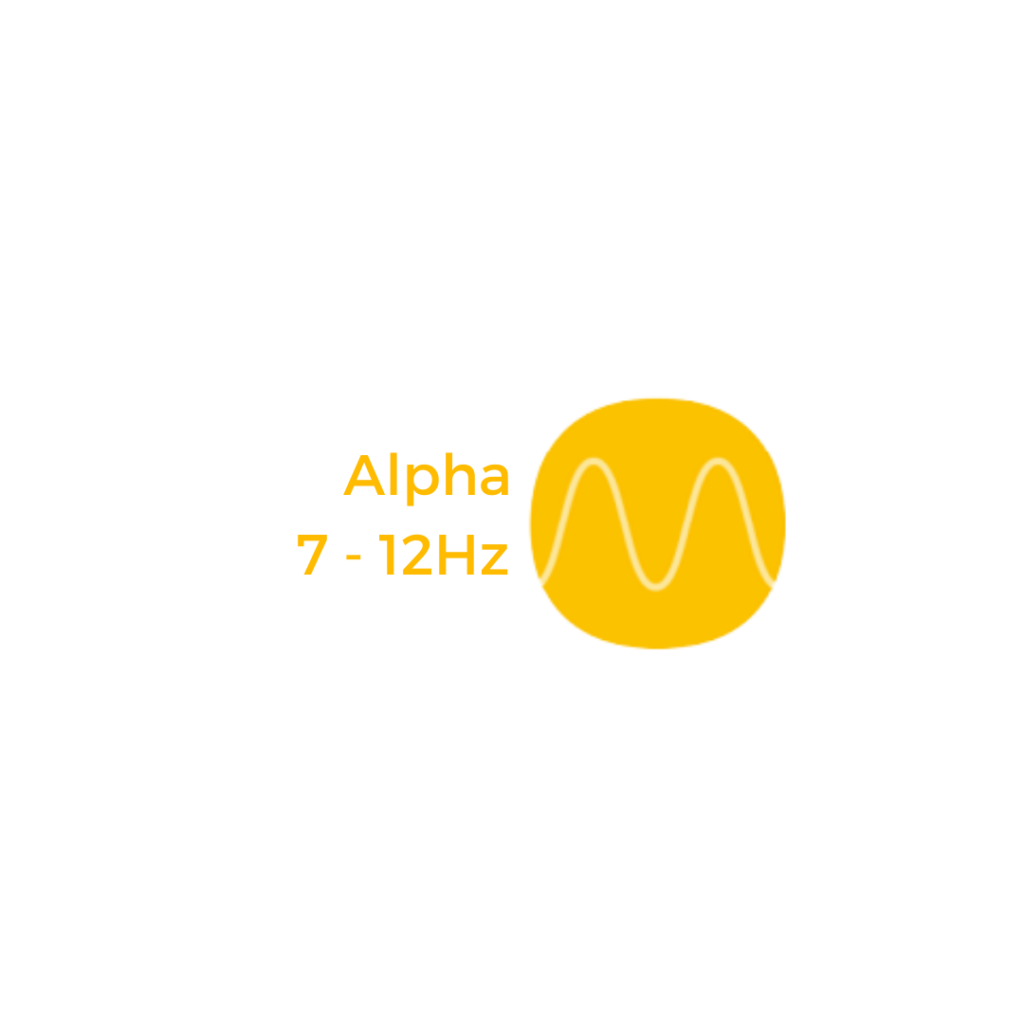
Alpha (7 – 12 Hz)
Alpha occurs whenever we close our eyes and bring ourselves into a calm state. Alpha levels are increased when in a state of relaxed wakefulness. They are also linked to inhibition and attention.
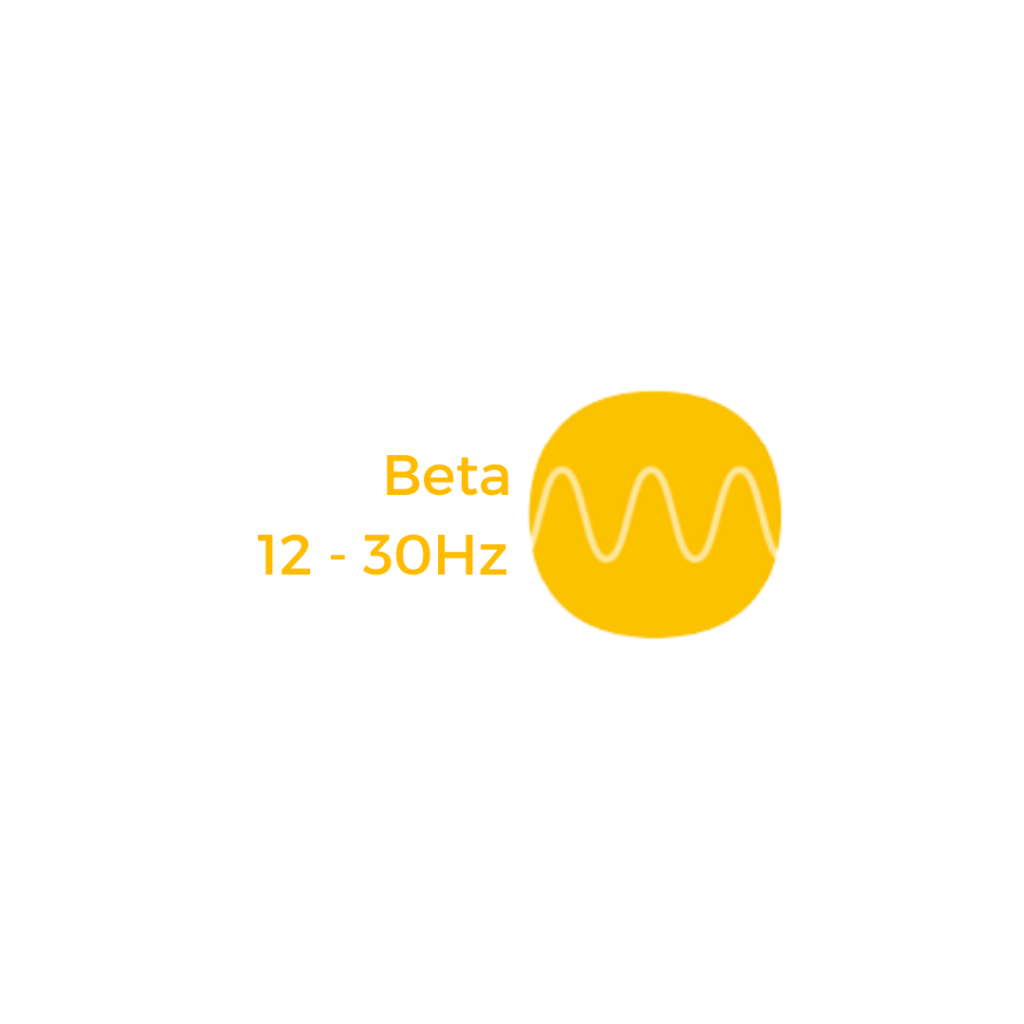
Beta (12 – 30 Hz)
Beta over motor regions, beta frequencies become stronger as we plan or execute movements of any body part. Interestingly, this increase in beta is also noticeable as we observe bodily movements of other people. Our brain seemingly mimics their limb movements.
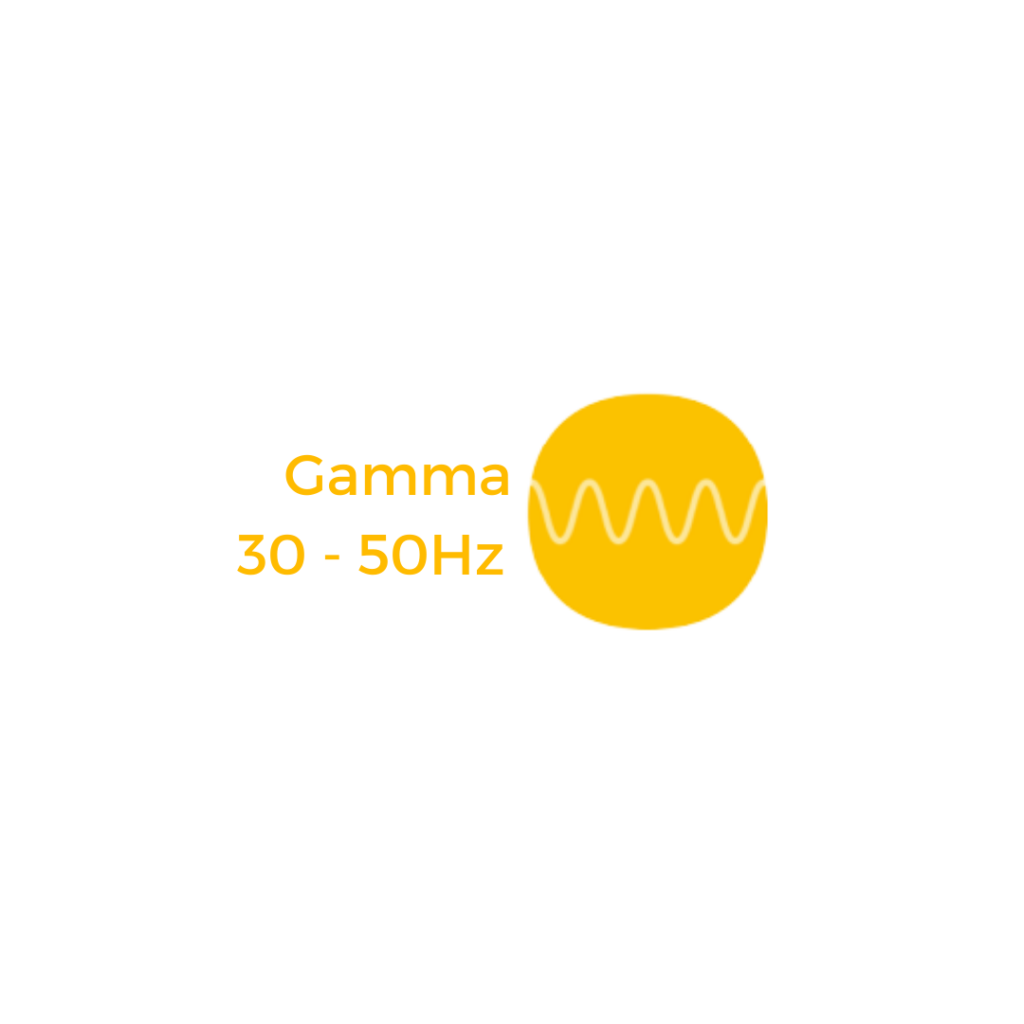
Gamma (>30 Hz, typically 40 Hz)
Gamma, in some instances reflects attentive focusing and serves as carrier frequency to facilitate data exchange between brain regions. It also can be associated with rapid eye movements, so-called micro-saccades, which are considered integral parts for sensory processing and information uptake.
EEG Data and Analysis
EEG is a cheap, non-invasive technique compared to other brain imaging processes. It can take thousands of snapshots of electrical activity across multiple electrodes within a single second.
It is tool of choice for studying the precise timing of attentional, cognitive, and emotional processing. EEG is the method of choice if you aim to understand and evaluate a persons’ desire, motivation and engagement or cognitive load and drowsiness levels in response to stimuli factors.
EEG is most effective when working in conjunction with other sensors such as GSR, Facial Expression Analysis, and Eye Tracking.
Eye Tracking
- When combined with EEG, recordings allow the monitoring of both respondents’ engagement and motivation as well as emotional arousal levels during exposure to emotional or cognitively engaging stimuli.
Facial Expression Analysis
- EEG sensors measure cognitive states related to engagement and motivation. However, using EEG on its own restricts the user from accessing if respondents are truly conveying positive expression in observable behaviour.
- Facial Expression Analysis can help validate EEG-based metrics of engagement, workload, or drowsiness.
GSR
- Reflects the amount of sweat secretion from sweat glands in our skin. Increased sweating results in higher skin conductivity. When exposed to emotional content, we sweat emotionally.
- GSR working alongside EEG is extremely effective as skin conductance is controlled sub consciously, such cognitive activity can be monitored by EEG.
- Therefore, adding GSR provides greater insights in unbiased emotional reactions of a respondent.
Technology in Action
EEG can be used in a variety of marketing driven research to better understand consumer behaviour. It can be used to measure the attractiveness of various advertising, digital communications, in-person store environments, product design, UX design, eSports, and overall design elements. As mentioned before, it is most effective when it complements bio sensors and other research methods.
Why Use EEG?
- EEG provides you with objective and implicit responses rather than relying on rational verbal communications. This is vital to understanding consumer behaviour which is mostly determined by unconscious responses instead of rational conscious ones.
- The measurements produced are precise to the millisecond, allowing you to measure initial response to stimuli.
- EEG is able to measure the brain’s cognitive processes, enabling you to predict consumer thinking towards elements such as deciding the optimal price for your product or service.